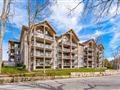
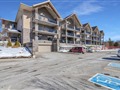
20 Station Sq 112
$456,021
Comparative Market Analysis
May 9, 2025
NOT AN ACTIVE LISTING
Historical Performance
| Period | $ Change | % Change |
| 1 Day | +$537 | +0.118% |
| 7 Days | +$108 | +0.024% |
| 30 Days | +$1,517 | +0.334% |
| 3 Months | -$537 | -0.118% |
| 6 Months | +$1,258 | +0.277% |
| 1 Year | -$26.8k | -5.55% |
| 3 Years | +$64.0k | +16.3% |
| 5 Years | +$115k | +33.8% |
| 10 Years | +$252k | +123% |
List My Property
Real Estate Statistics
Financing Solutions
AS SEEN ON


Are You a Licensed Real Estate Agent or Broker?